Alone in the Corner Part 3: The Expected Value of a Corner Sequence
In Part One of this series, I introduced my corner delivery zone visualization.
In my second piece I used that to look at the differences between corners overall and inswinging vs outswinging corners.
I finished that up by looking at the value of direct shots from corners, which is about 2%.
That was the main point of focus for a lot of previous analyses.
But as I alluded to previously, that is only part of the story.
What about indirect corners, including flick-ons?
If we only consider direct shots, obviously we cannot even begin to analyze the value of a short corner.
What happens after a corner is cleared?
Shouldn’t we include the probability of another corner in the evaluation of the expected value from a corner?
The same goes for rebound shots - which might be very valuable if close to goal - and shots that originate from second ball regains.
Doesn’t it make sense to include those as well in the analysis?
I think we have to.
That will be the main point of focus for this article, and I hope at the end of it, we will have a better understanding of the true value of a corner.
To start, let us look at the attacking teams first actions after a corner.
Indirect Corners
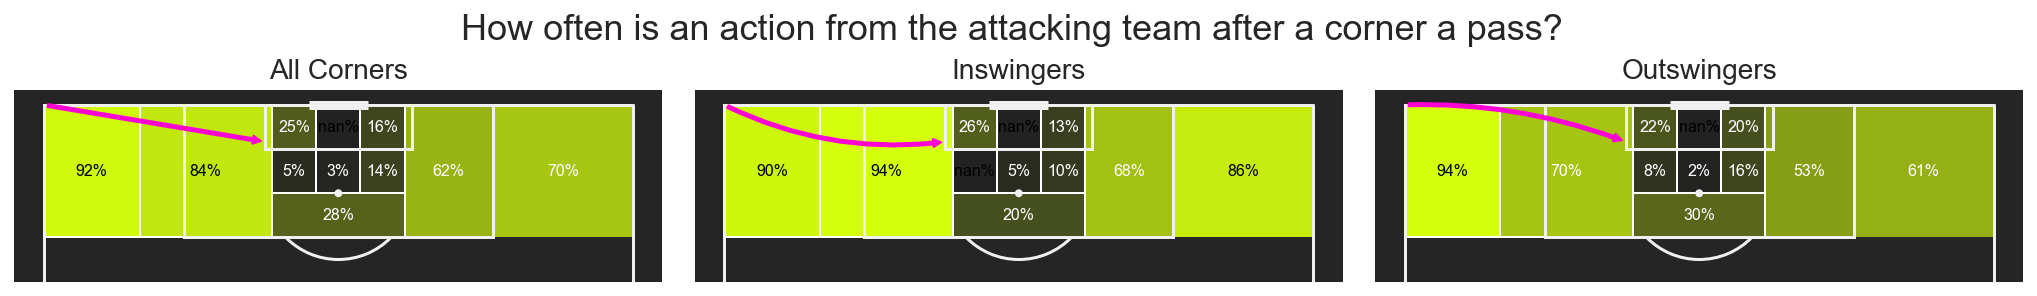
Looking at the six zones closest to the goal, there is a pass as first action around 10% of the time.
That is only a small proportion of the time, considering that this only takes offensive actions into account. For all corners combined it’s a much smaller percentage.
I should mention that this is also a very small sample size, so it’s not worth looking into further at the outcomes. Identifying an intended shot that ended up being a pass is another problem that might obscur the analysis.
It is worth looking into zones 8 and 9 , to the left and right of the center zones (N=46 and 26), though:
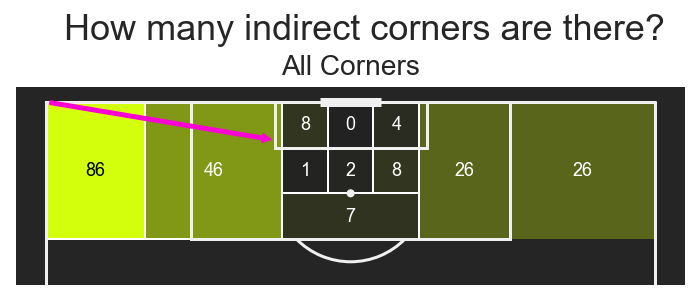
Still, not a huge N, but this will do.
In this sample there is an average xG of about 7% per indirect corner for first shots. Taking further shots within the sequence into account, it goes up to around 8%.
Not too shabby. Even though you cannot draw conclusions from this small sample size, it is worth looking into whether indirect corners to these zones can be a successful strategy.
It also might make sense from a theoretic perspective.
Defending is rightfully focused on the most central areas. So a corner should be most likely to connect to a teammate while also getting the ball as close to goal as possible in those areas. Add to that the “surprise” of a pass that can catch the defense on the wrong foot, and you may have a decent alternative to add to your training of set piece routines.
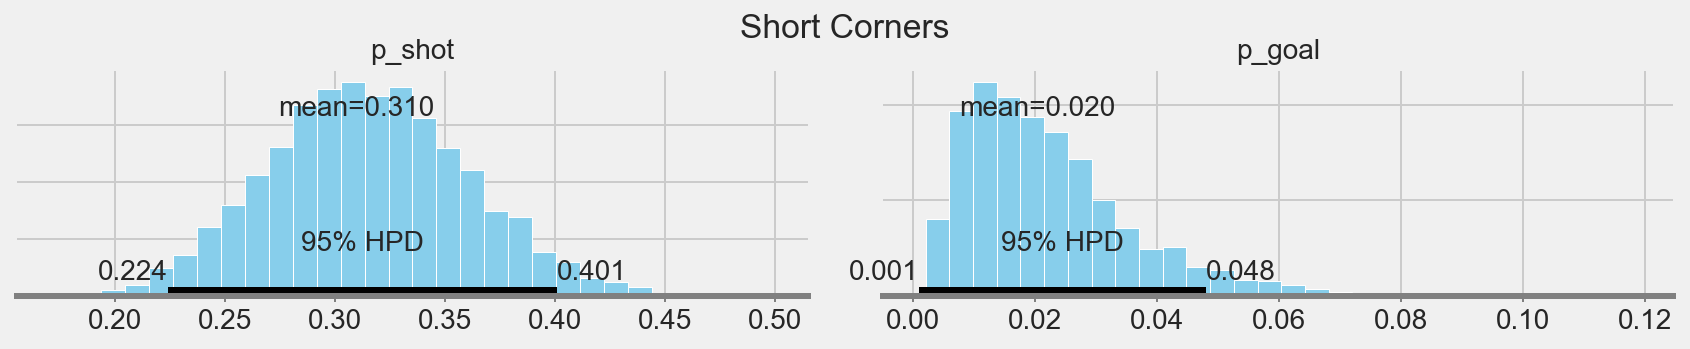
Short Corners
Around 11% of Corners were played short to zone 10.
The mean xG of those sequences is slightly above 3%.
In this sample at least, there is not much value added from rebounds and regains.
Underwhelming.
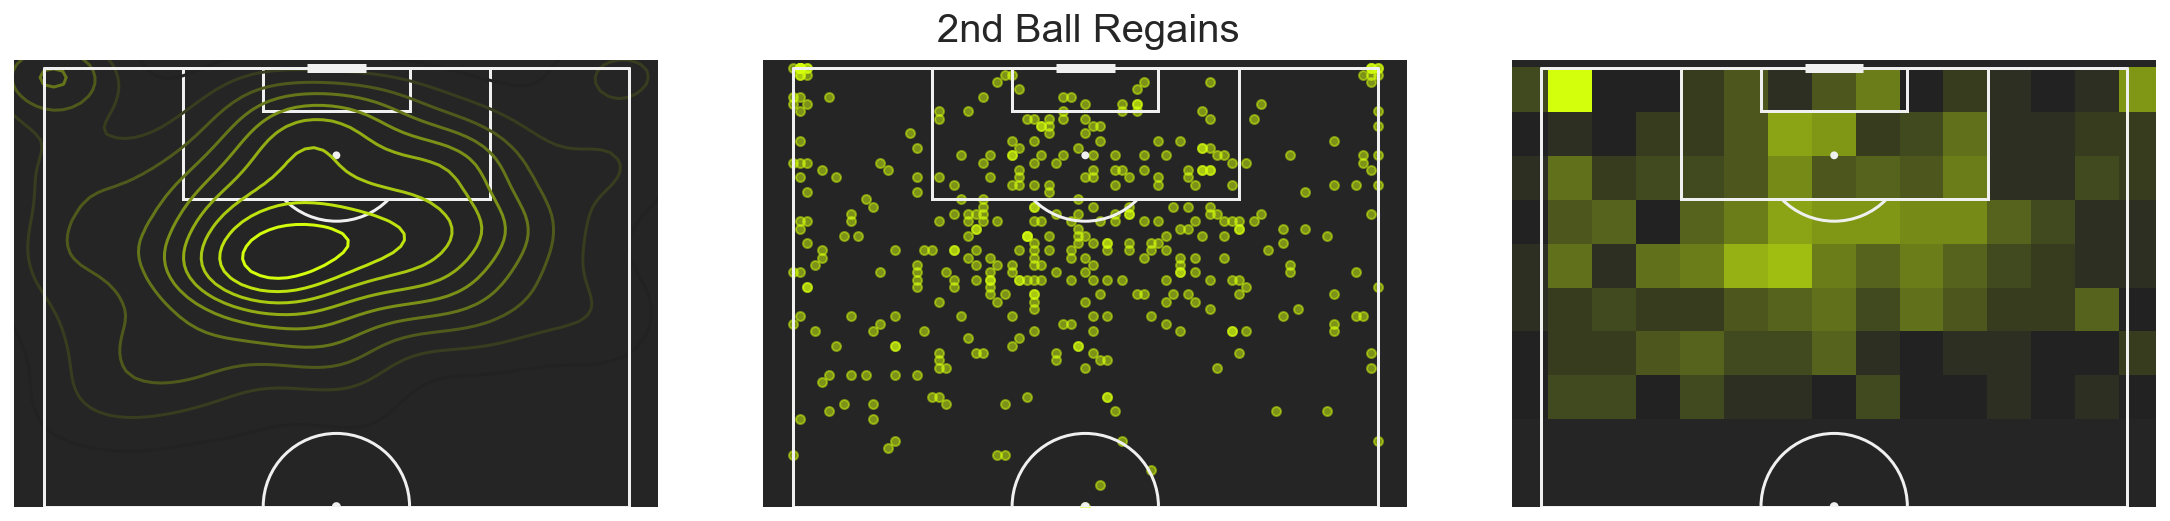
The Value of 2nd Ball Regains
![]()
Overall 22.5% of all corners that were first cleared - which I defined as the defending team making an action of [‘Clearance’, ‘Goal Keeper’, ‘Block’, ‘Ball Recovery’, ‘Interception’] - still result in a shot.
That is a significant proportion that adds decent value to a corner.
![]()
Overall we still expect to score about 2% of the time from the ensuing sequence after a corner was first cleared.
Considering that about 60% of corners are cleared at first contact, this adds roughly 1.2% scoring probability to the overall expected value. Not too bad.
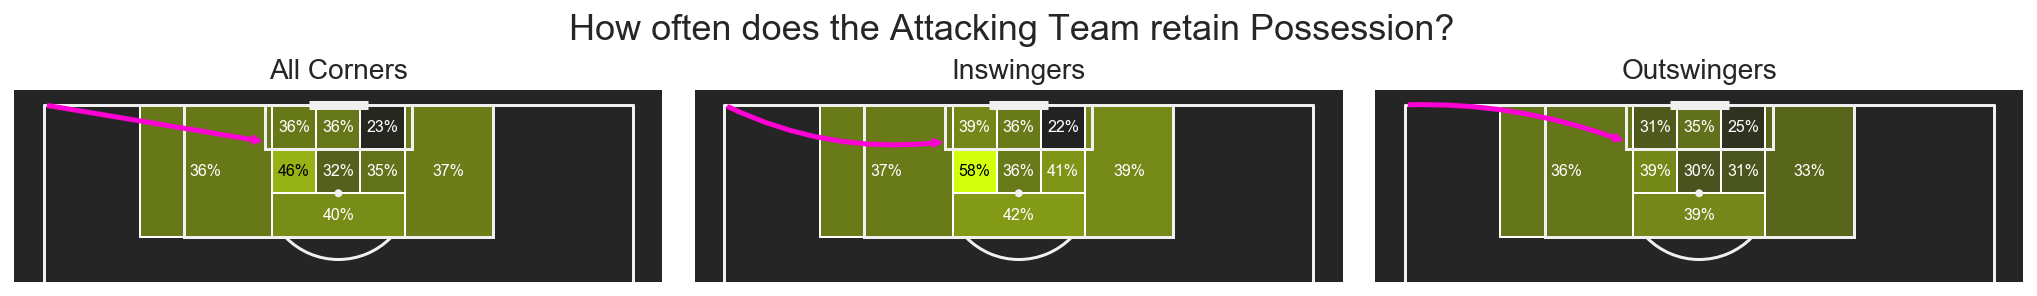
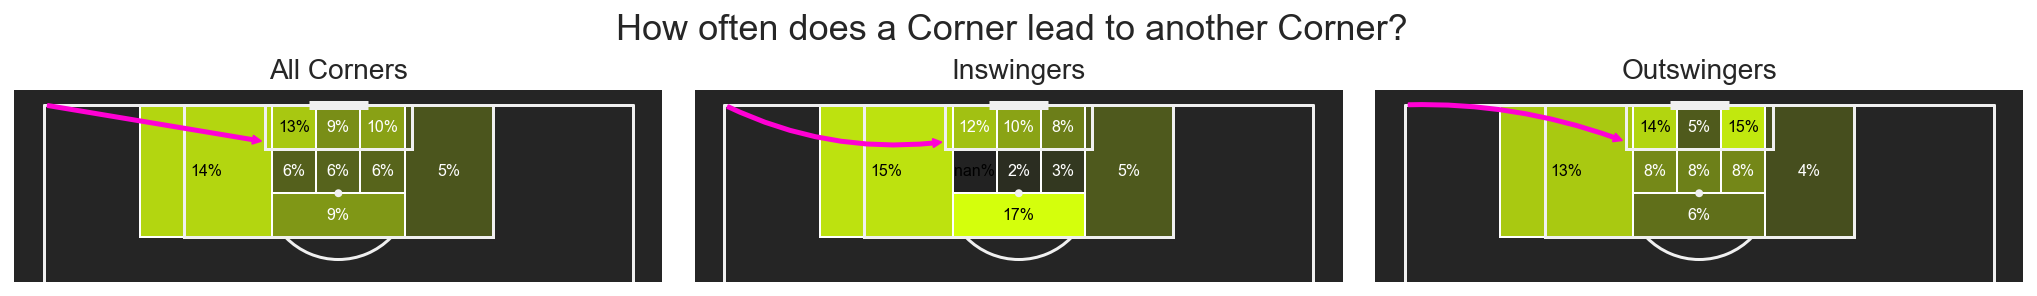
How do corner sequences play out?
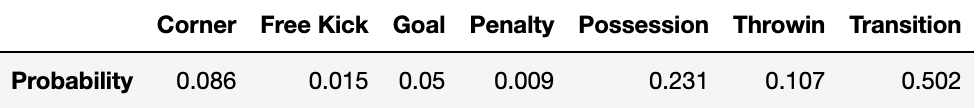
Below you will see ho often the attacking team retains possession, that is end up with a free kick or throw-in or recycle possession, and how often do corners lead to another corner.
What stands out here is that especially inswingers that connect at the near post lead to retained possession most often. In general inswingers lead to possession slightly more often than outswingers, mostly because more clearances result in throwins.
We can now combine all the above information to compute the overall value of a corner.
We take the observed probabilities of all absorption states that corners result in. For corners we multiply this again repeatedly with the absorption probabilities until all corners absorp to other states.
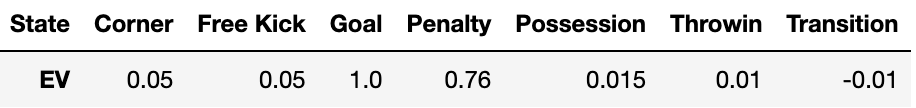
Then we can assign expected values based on what we know or assume the value of those situations to be.
For a free kick I assigned 5%, for a possession (recycled outside the attacking third) I assigned 1.5% as a possession following from a corner is usually one where the defensive side is pushed back and you have attacking numbers around in and the box (this might a be low estimate), for a transition I assigned 1% - from my analysis the overall value of shots against from corners is 0.4%, or about 0.8% for every transition faced. So again a slightly conservative estimate.
Throw-ins I rated as less valuable than a possession, because they often result in turnovers. If a team is good at them, maybe they are worth more. So again, this might be a more conservative estimate.
In total this gives us around 6% expected value for any corner, quite a lot higher than previous analysis of direct shots from corners has made us believe - It is actually almost triple the value!
There also isn’t much of a difference between inswingers (6.2%) and outswingers (6%).
![]()
As the above analysis is based on actual goals, we can have another look at the overall xg that resulted from corners - all shots from regains and rebounds included.
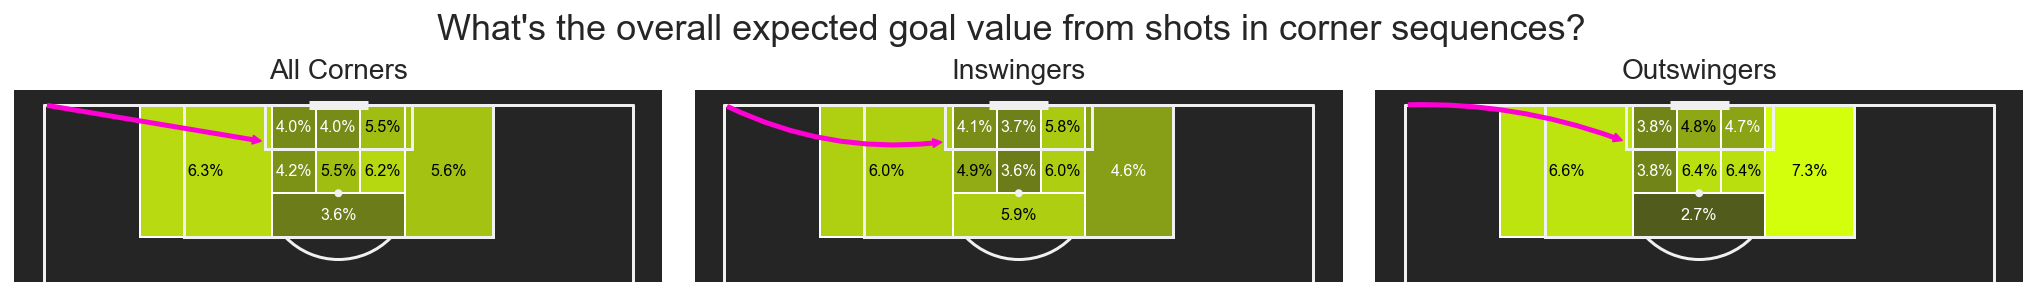
The mean xG value in this sample is 4.7% overall, 4.4% for inswingers and 5.1% for outswingers. Overall this is quite close to the actual goal counts.
Interestingly, besides the obvious danger zone between the 6yard box and the penalty spot, in this admittedly not huge sample, the far post zones show higher values, as do both zones towards the outside of the box.
Whether that pattern is only an artifact of this dataset or a general trend would definitely require more analysis.
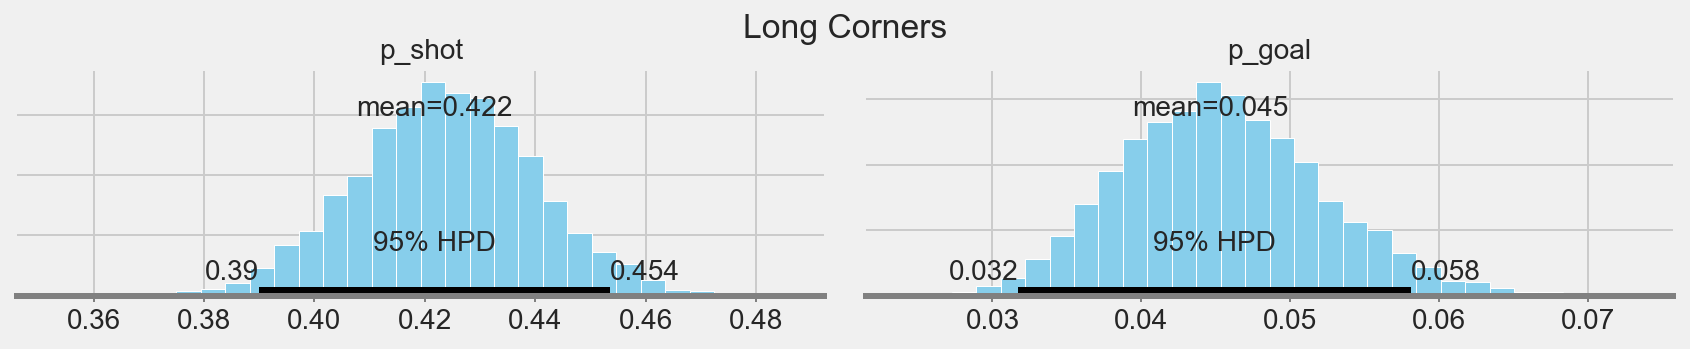
To be a little more rigorous, I ran a basic bayesian logistic regression for the shot and goal likelihoods.
The main advantage is that this shows us the remaining uncertainty around our estimates.
I also ran a model with inswinger as explanatory variable, and a hierarchical model with the corner target zones as groups, but according to the WAIC weights they offered hardly any extra value.
Below you will find the posterior predictive plots for all long corners, all short corners and in- and outswinginging long corners seperated.
Long Corners:
Short Corners:
To note is the much higher uncertainty here, because of the much smaller sample.
Sampling mean values from both posterior distributions, we find that the probability of a goal for long corners is in 92.5% of cases higher than that of short corners.
Looking at modeled mean xG values this goes up to about 96%.
So even though it is a rather small sample of short corners (N=100), it points heavily towards long corners being the dominating strategy. A larger sample size could be able to provide a definitive answer.
Inswingers vs Outswingers:
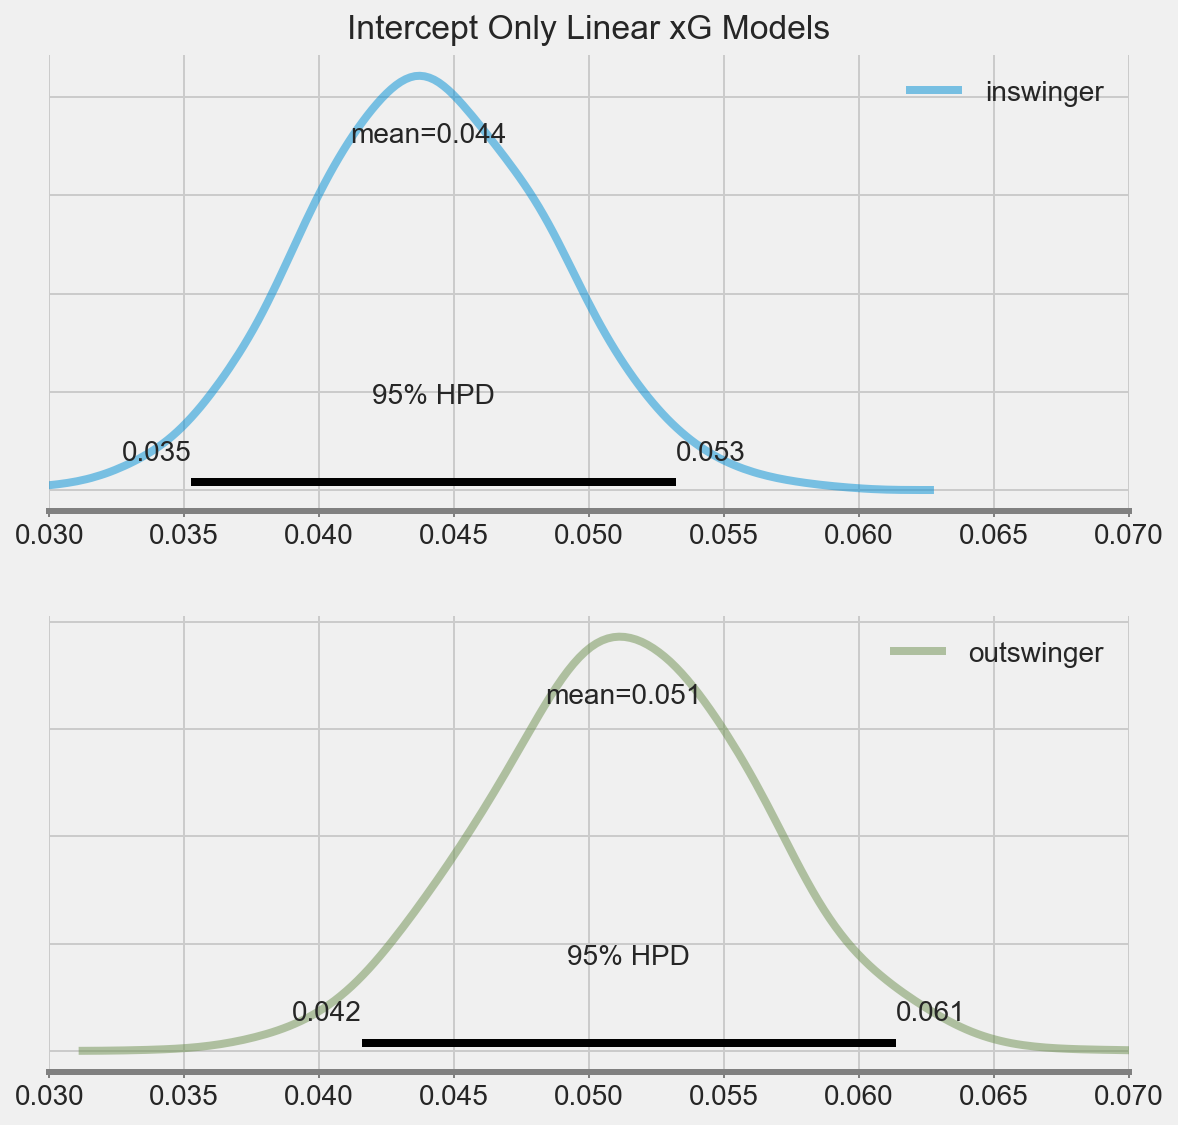
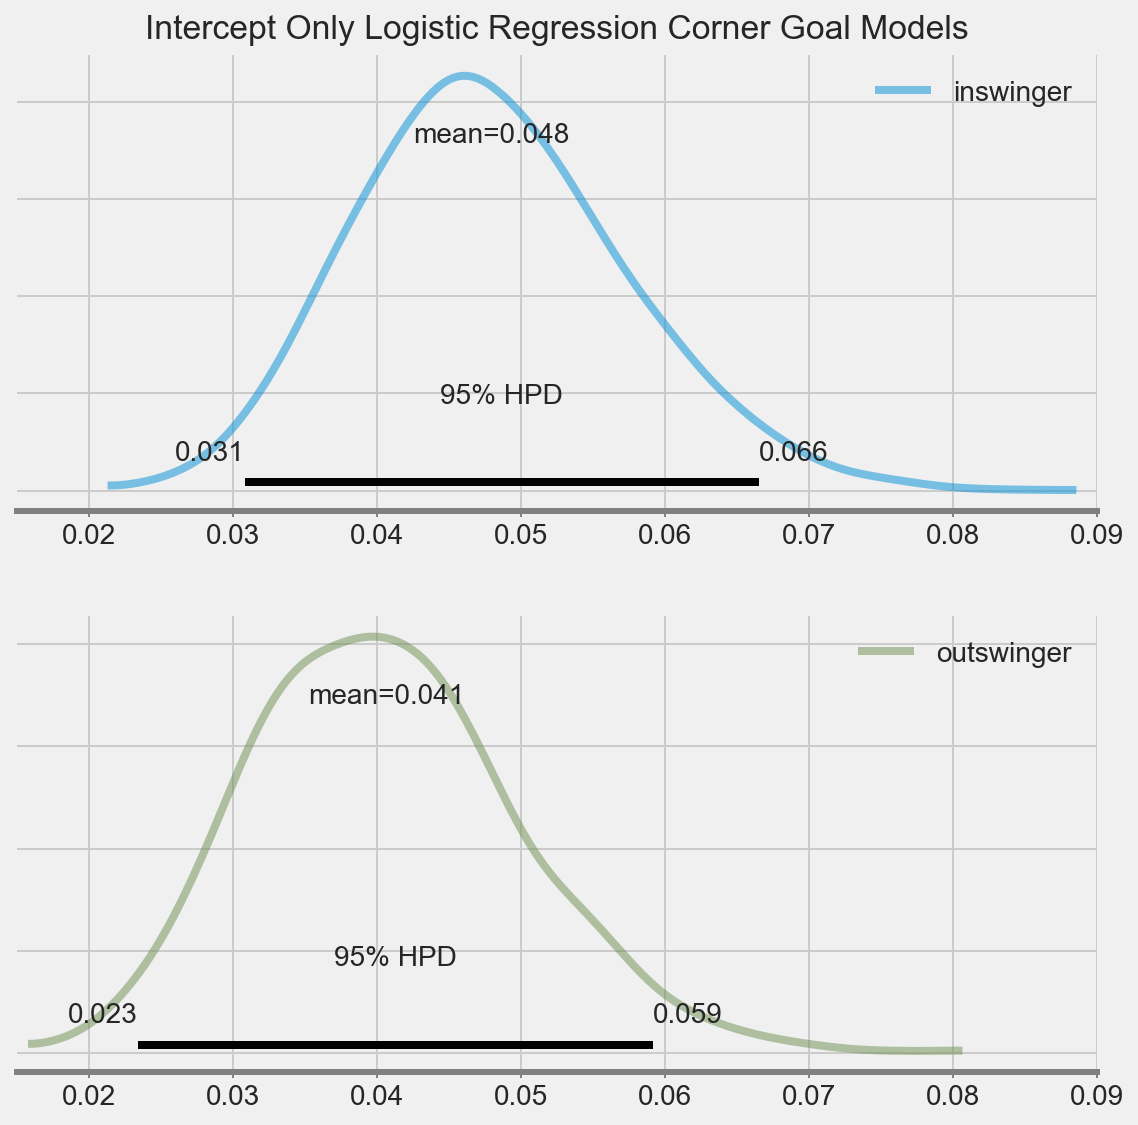
Regarding the question of inswingers vs outswingers, you can see from the above plots, that there are no conclusions to be drawn from this dataset.
Outswingers created more xG on average, while inswingers lead to more goals.
For both goals and xG, the highest posterior intervals are still wide and overlap heavily.
Revisiting Paul Power’s Mythbusting Set Pieces
Lastly, I want to look over a few of the myths that Paul Power covered in his Mythbusting Set-Pieces in Soccer paper
● Myth 1: A team is more likely to score from set-pieces compared to normal play possession
o Confirmed: 1.8% chance of scoring from set-pieces vs 1.1% in open play (p < 0.05)
Confirmed: About 2% corners are scored directly, while the overall EV of a corner is close to 6%
● Myth 4: A team is more likely to concede from their own corner than score
o Busted: 0.2% chance of conceding vs 2.1% of scoring a goal (p < 0.05)
Confirmed: Corners show an xG of about 0.047 on average, with an xG Against of only about 0.004
● Myth 5: Teams are more likely to score from in-swinging corners compared to out-swinging or driven corners
o Confirmed: 2.7% chance of scoring from in-swinging corners vs 2.2% from out-swinging (p < 0.05)
Not Confirmed: Sequence xG of 4.4% for inswingers and 5.1% for outswingers, while overall EV is around 6% for both in- and outswingers.
● Myth 6: In corners, a goal is more likely to occur from a shot from the second-ball rather than a shot directly
o Confirmed: Teams have a 2.5% chance of scoring after winning the second ball vs 2.0% directly (p= 0.86)
Confirmed: direct shots contribute 2%, but 2.6% If we include rebounds and regains from those shots.
Shots from regains after the corner was cleared account for about 1.1% and shots from indirect corners 1% EV
● Myth 7: In corners, a team is more likely to score from a flick-on compared to directly shooting from a corner
o Confirmed: Teams have a 4.8% chance of scoring from a redirected corner vs 2.0% directly (< 0.05)
When another pass is made after a corner, the mean combined xG is 7.4% - 0.8% total considering all corners.
A direct shot from a corner has a mean xG of 10.8% - 2.7% total considering all corners.
Overall direct corners account for more goals / xG.
But when a shot is actually taken from a pass, the chance quality is much higher: About 20% xG
To recap, the most important things we learned about corners is:
- direct shots show an overall xG of 2% per Corner, rebounds increase this to about 2.7%
- indirect corners and shots from 2nd ball regains increase the xG to about 4.7%
- Retained Possession, Throw-Ins and Free Kicks increase the overall Expected Value of a corner to roughly 6% while accounting for the negative value of transitions.
Also worth considering, though an analysis of a bigger sample size is required:
- short corners show less xG in this sample, but a few big chances might swing the picture quickly. I would say, if you don’t have a real plan on what to do after a short corner, don’t play it short.
- Indirect corners seem promising. I would assume they require more practice though? If you can train a few simple routines, it might be worthwile.
Bonus: An exploratory look into clearances and ball regains
![]()
![]()
Positioning for second balls and to suppress counters is another important aspect of a teams corner strategy.
Above you can see a few different ways to visualize clearances and ball recoveries.
Remember when Manchester City positioned in a line similar to the above clearance cluster centers? (Picture from @coachdogge):

It could make sense to position like that to maximize the players impact. Even more so if you are facing an outswinger anyway.
The back part of the 6 yard area should not be targeted very frequently, is covered by the goalkeeper, and the defender will usually still have the time to move back inwards.
Simililarly, you can inform the positioning of players around the box to maximize the amount of ball recoveries - both offensively and defensively.
Every little thing adds expected value to your corner strategy.
So as one of the few parts of the game that are static, are you going to pay corners the attention they deserve?
At five corners a game, that is 0.3 expected corner value per Game or 10.2 Goals a Season (11.4 at 38 games). For the average team, that is.
If you have comments or feedback, feel free to reach out to me on twitter @danzn1
The Data used in this article is Statsbomb’s free Dataset