Alone in the Corner - Part 2
In my first piece on corners I gave a brief motivation on my work on corners and introduced my method of seperating deliveries based on the zone of first contact.
In this piece, I will have a further look into
- how corners are delivered
- my method of analysis
- where corners connect
- the rate of unsuccessful connections
- the rate of direct finishes
- the expected goal values of direct shots
- the overall expected value from direct shots
- and the visualizations I developed to portray this information.
To rehash, those are the delivery zones I chose:
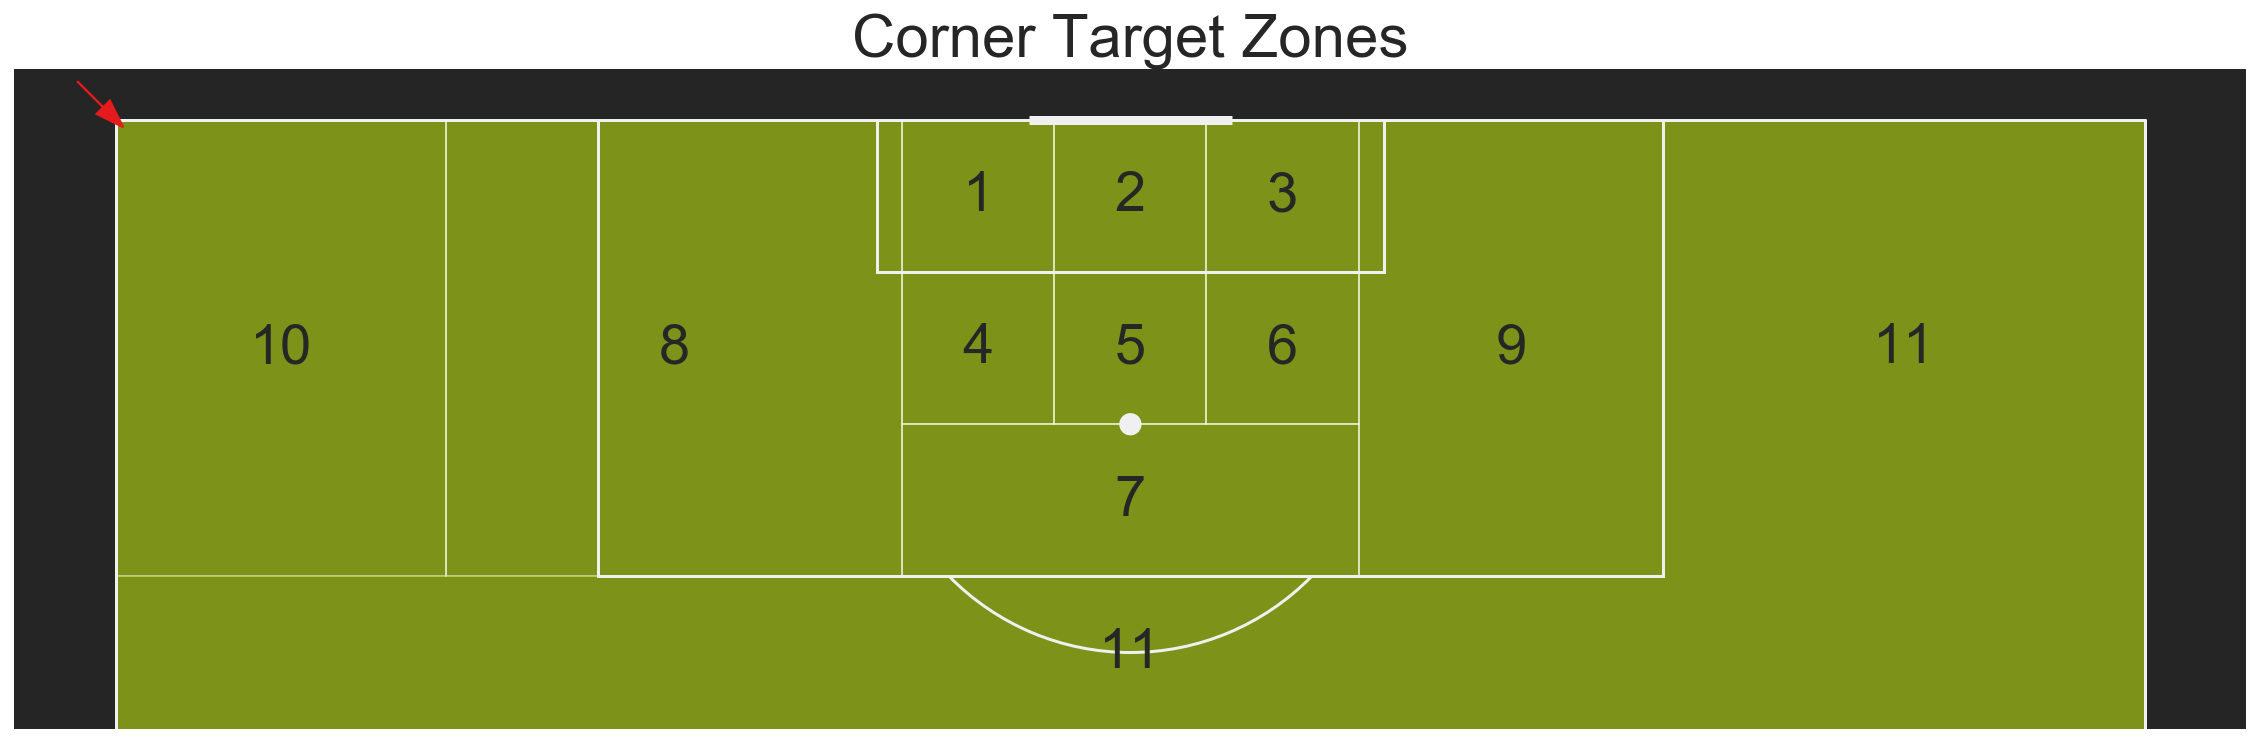
I will use these later on to analyze differences between zones of first connection after a corner was taken.
First, I will introduce another visualization I made though.
Ted Knutson has talked about inswingers over outswingers, Paul Power found the same, so naturally I wanted to look into this as well.
First, I needed to find a way to differentiate between in- and outswingers.
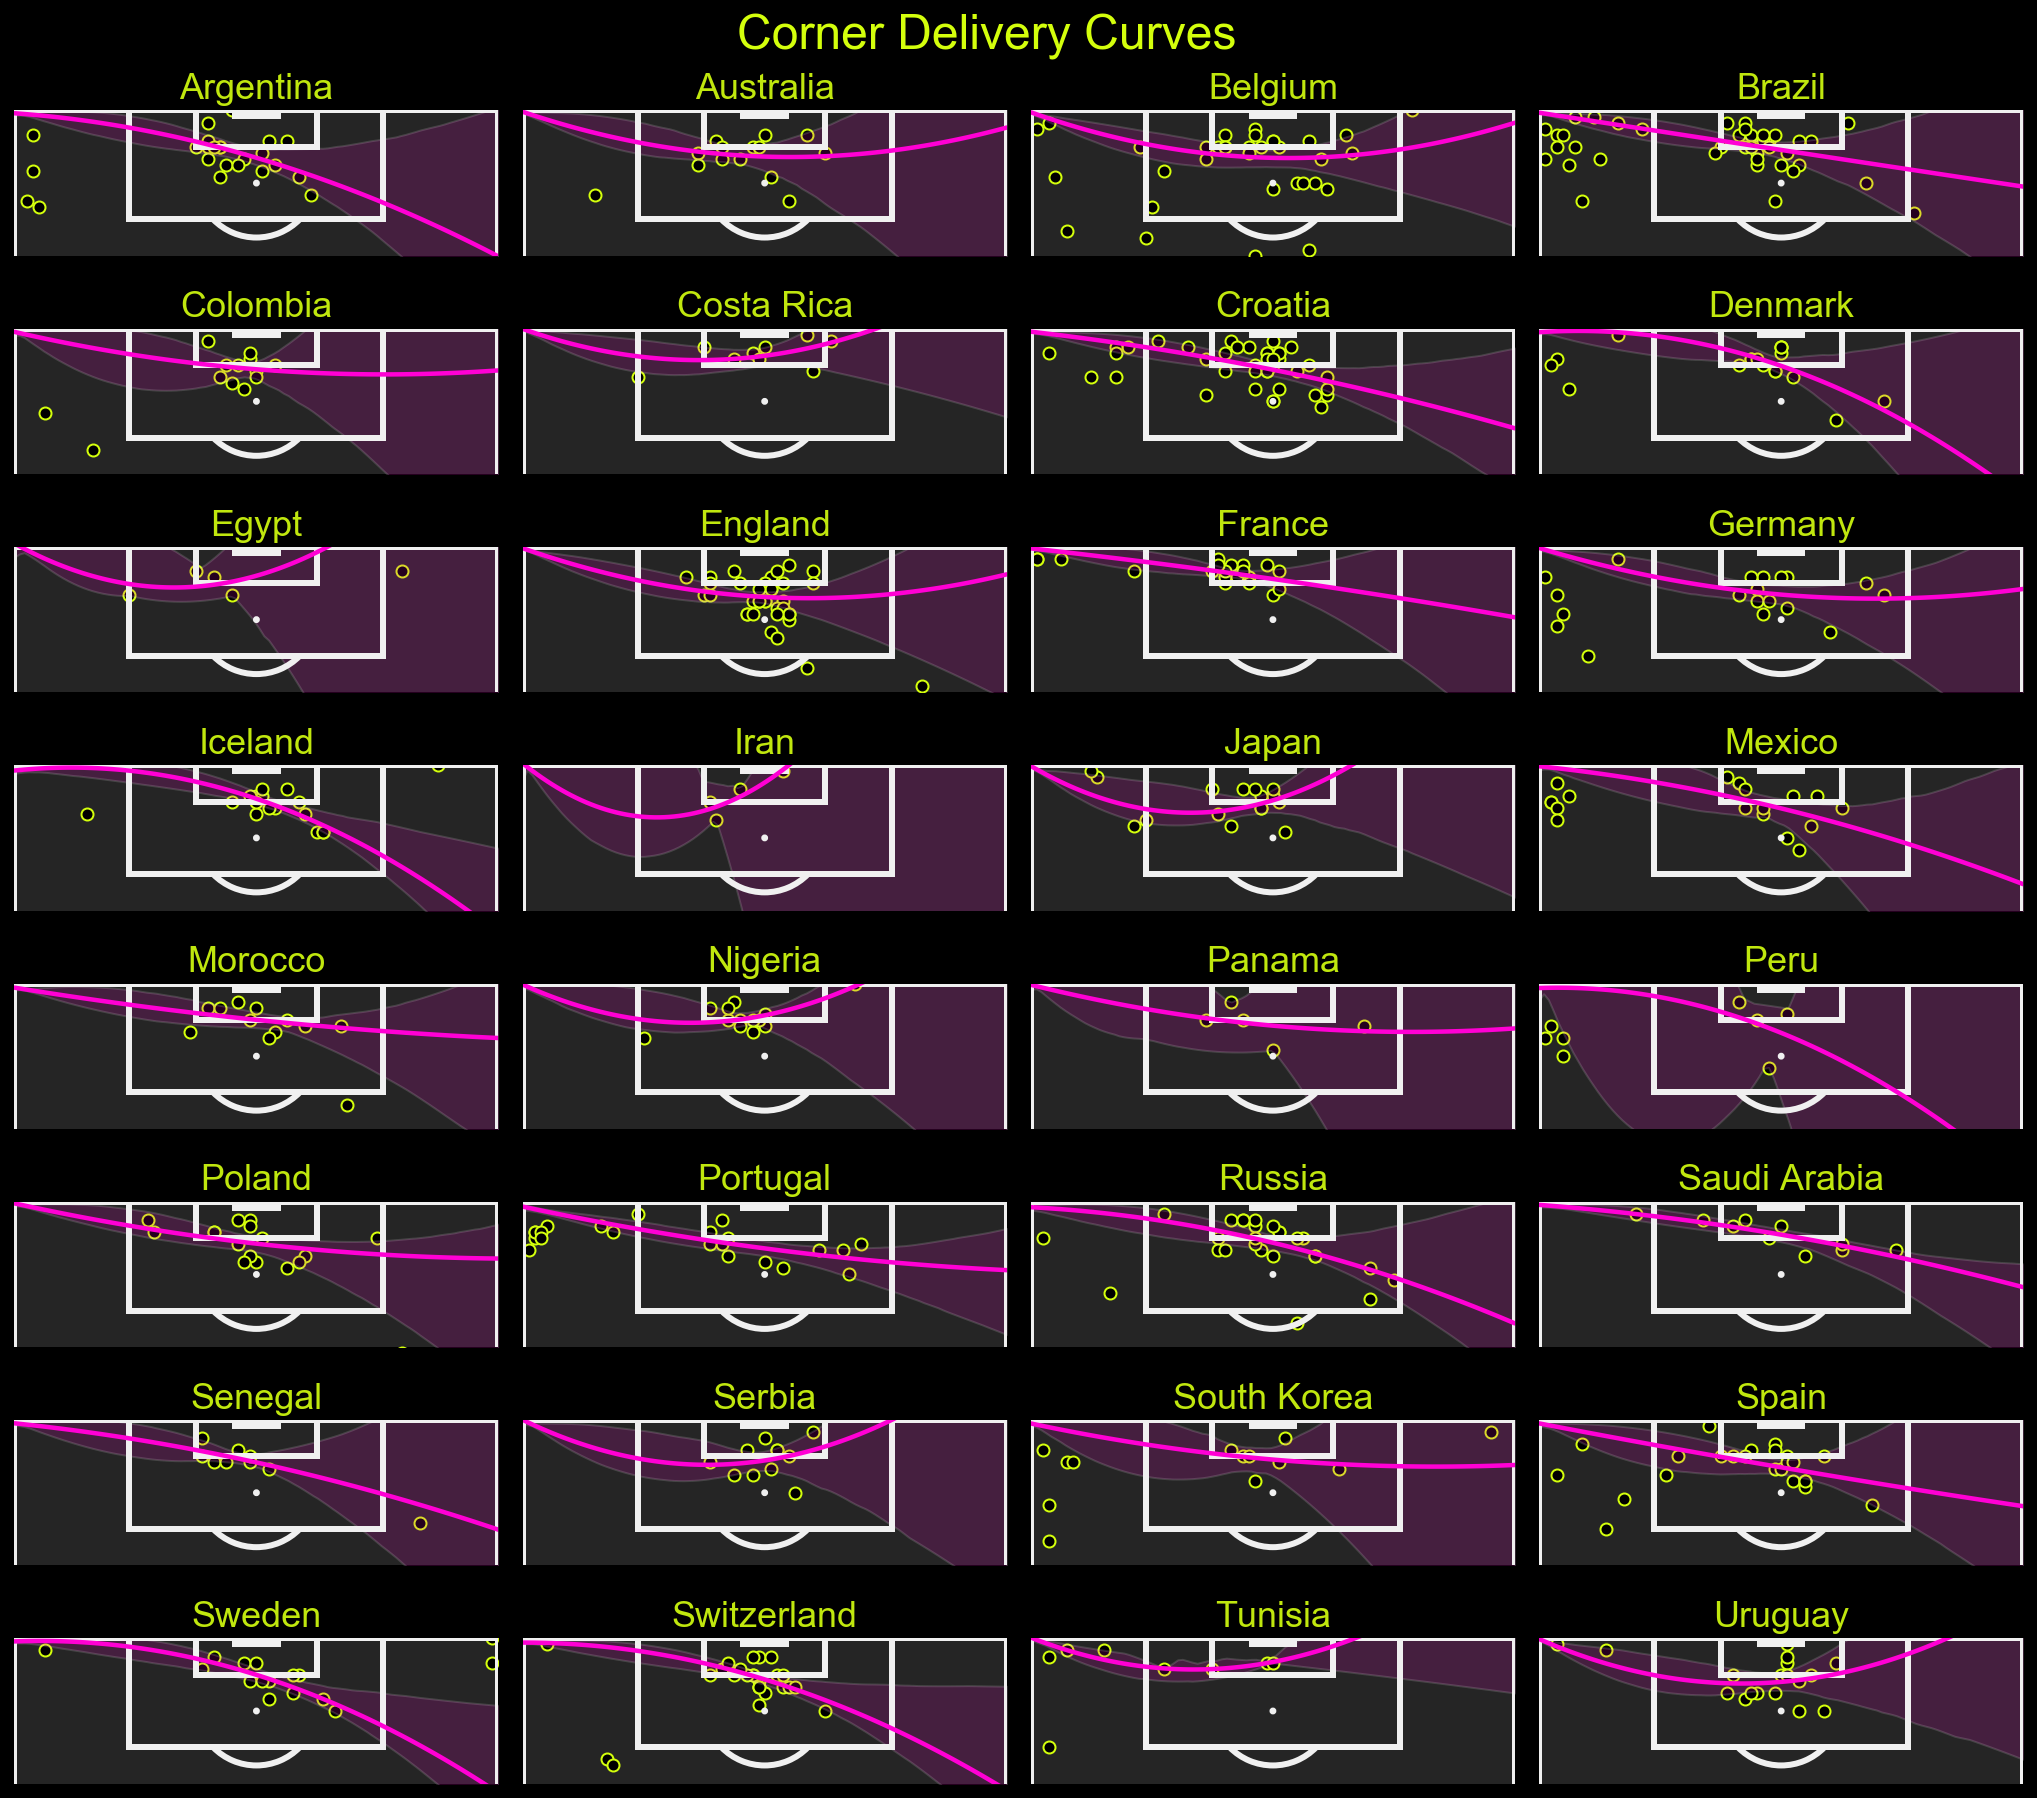
A simple 2nd order polynomial regression plot with seaborn later, some coloring and I had a visualization ready to show the delivery curves of corners, which should be quite helpful in match preperation:
The first shows all corners from the teams at the World Cup - to see meaningful patters one would have to differentiate between different set-piece takers, their footedness and the side from which the corner is taken.
I show that for the most frequent corner taking players in the second plot.
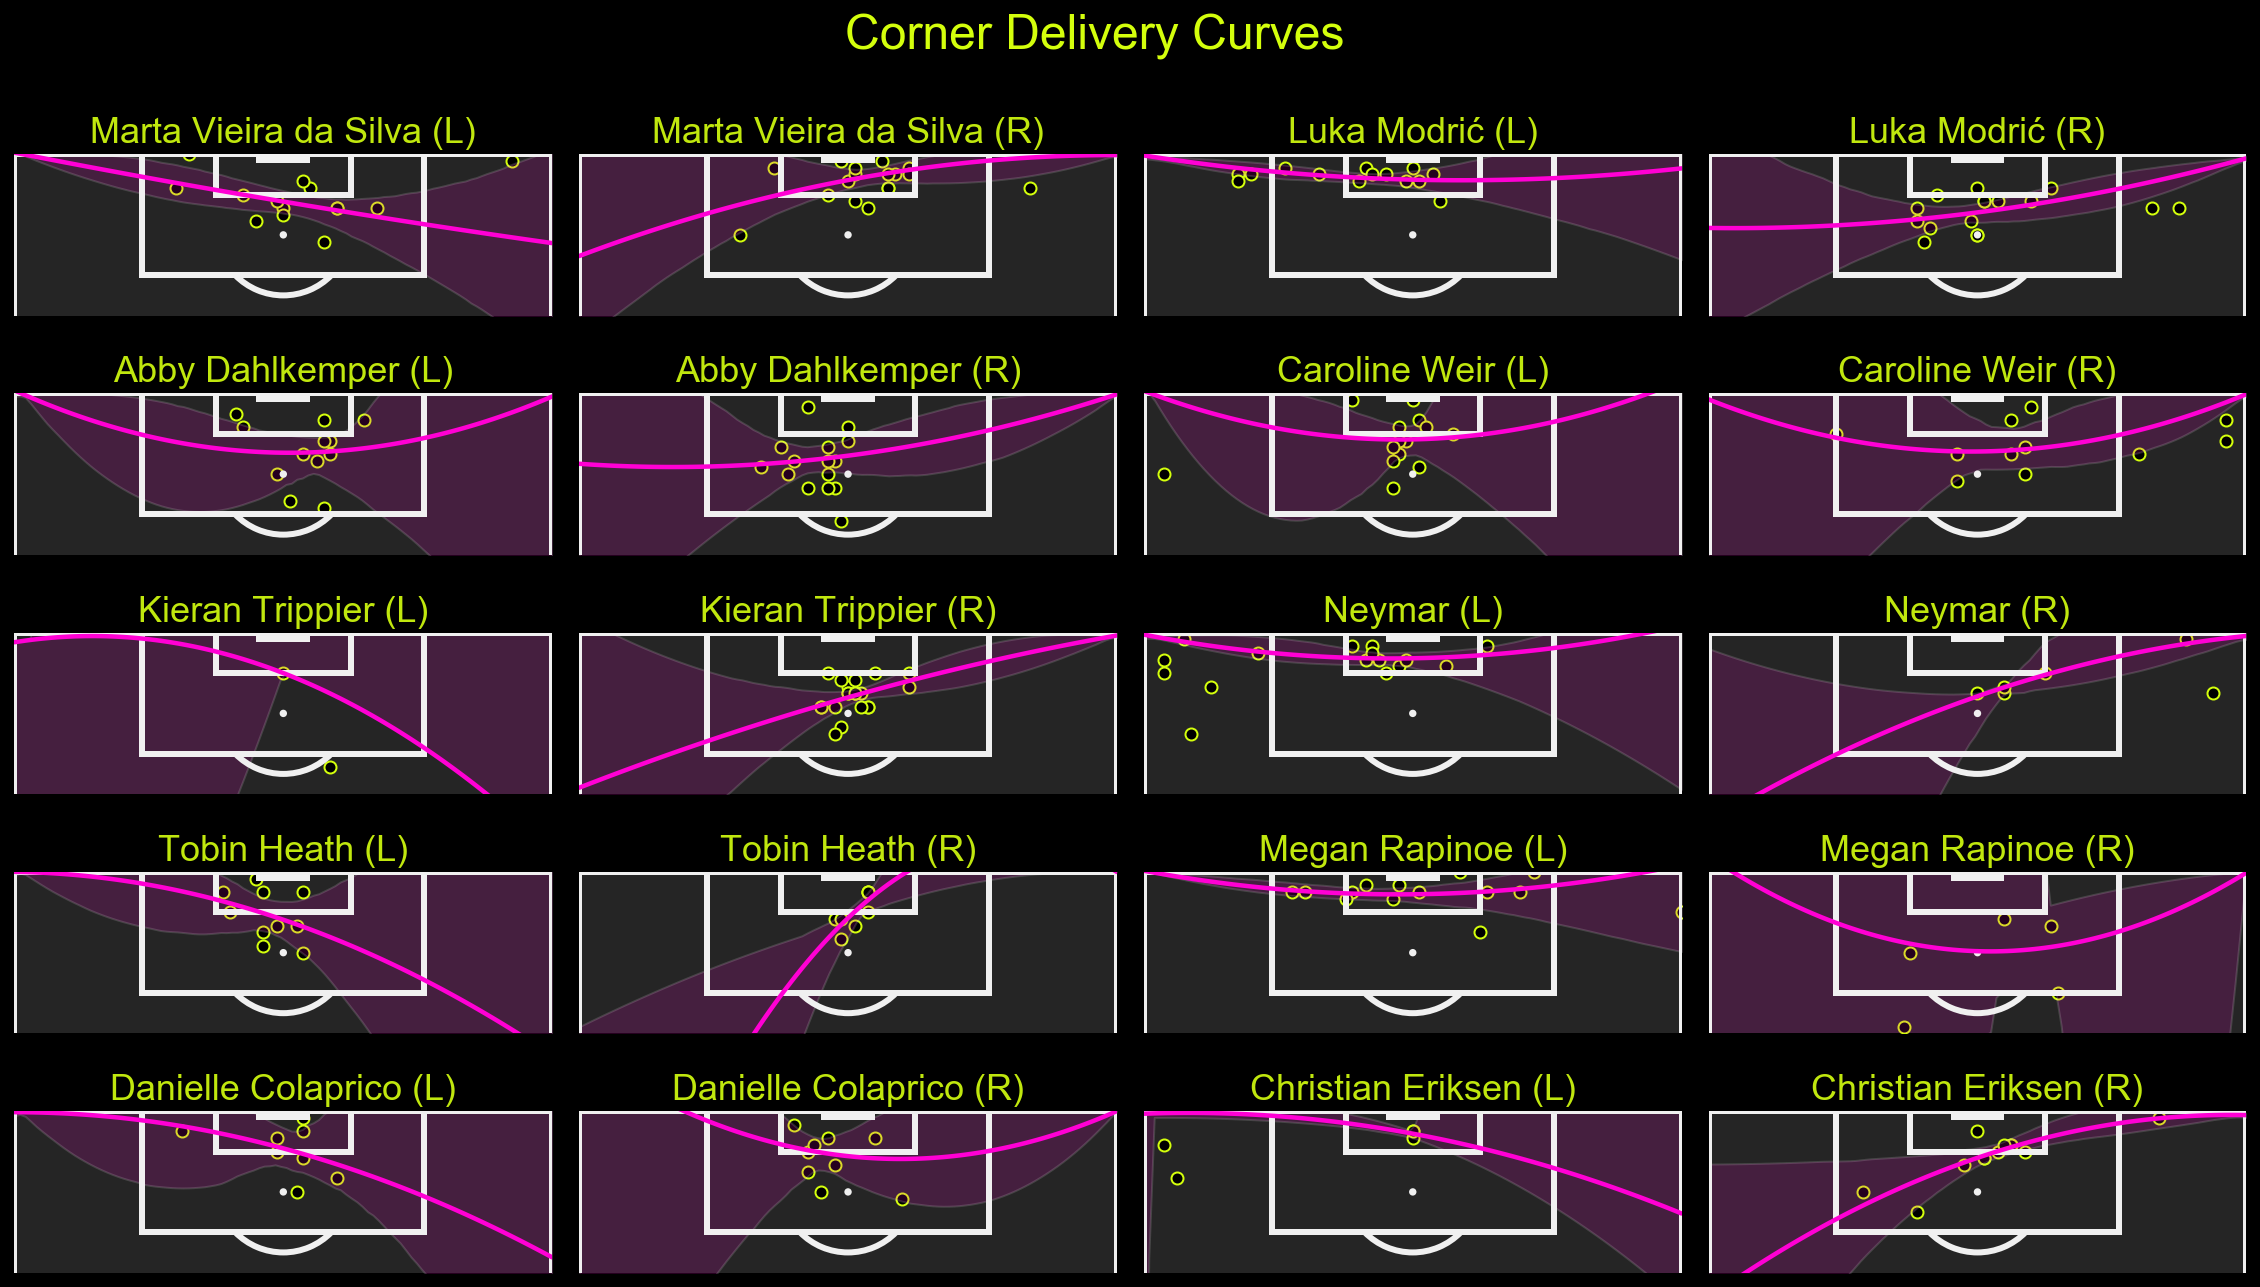
With as litle data points per team or player that I have, they already show some nice patterns, when you seperate by sides.
(I only considered connections in zones < 10)
Looking at Luka Modric’s corners, we can see that corners from the left - inswinging targeted into the 6y area - are very different from the ones from the right - taken (although not seen here) most likely outswinging with the right foot and targeted between 6y area and the penalty spot.
The same holds true for Neymar and Marta.
An Exception seems to be Abby Dahlkemper: from both sides she will target the area behind the penalty spot outside the 6yard area, with barely any corners being connected to beneath the center.
Clearly this will help a lot in preperation and possibly adjusting positioning based on who takes the corner and with which foot it is taken.
Only after I created those did I notice that there wasn’t even a need to plot them to figure out the corners swing. Statsbomb has a qualifier for the foot with which a pass is taken - ‘pass_body_part_name’. D’oh, but that turned out well.
A method to analyze corner sequences in detail
As Paul Power et al. outlined, previous research was often limited to analyzing direct shots from corners.
But a corner does not end with the first action. What about flick-ons? What about rebound shots or second balls? There wasn’t really research on this available. Nevermind that a failure to consider further actions makes analyzing short corners impossible.
They solved this issue by introducing a ‘set-piece grammar’, which allowed them to capture set-piece sequences in more detail.
Below you will see my slightly adapted method:
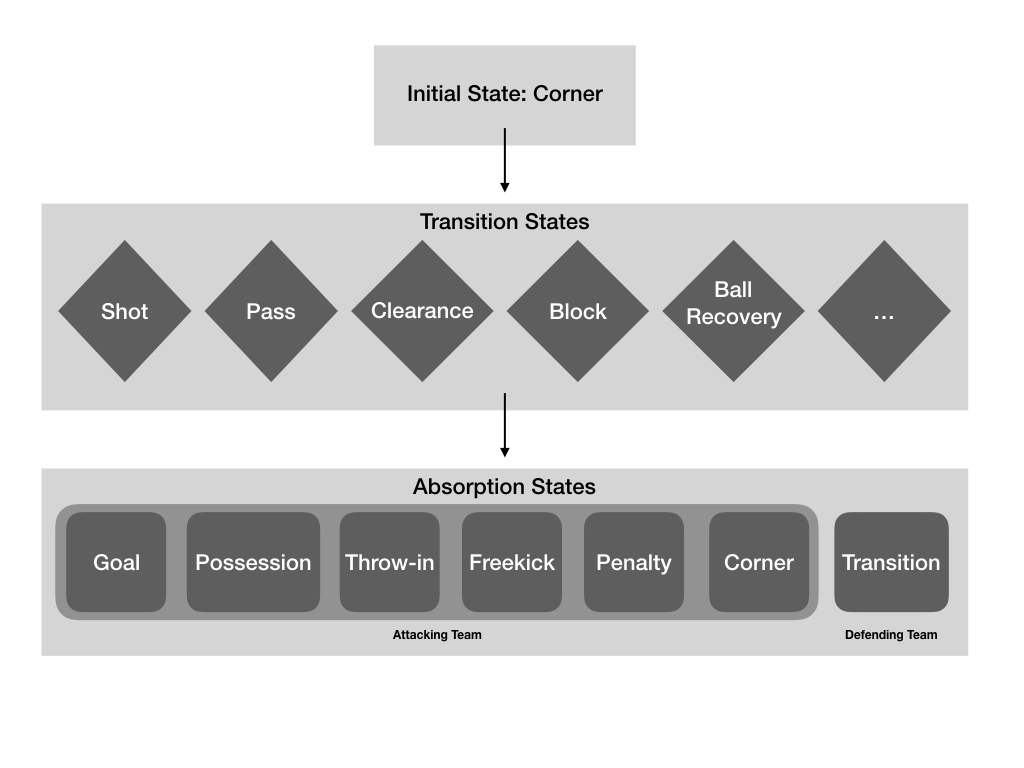
What this shows is that after the initial state - the corner being taken - you will have a non-sequence-ending transition state (eg. a pass), which will lead to another transition state (eg. shot) that leads to a goal - a sequence ending state - called an absorption state.
Multiple transition states may occur in sequence.
A corner can also directly result in an absorbing state (like a goal or an occuring transition when the corner goes out of play).
When an absorption state is reached, the sequence is considered as terminated.
This allows us to capture a corner sequence in full - including the possibility to consider flick-ons, rebound shots, 2nd ball regains and possibly also look for any shots from occuring counter attacks.
This is needed, as only when you consider the probabilities of each of the possible absorption states and their expected value, can you analyze corners in full detail and get a comprehensive view of how much a corner is really worth.
Method
If you don’t care about the method and definitions in detail, feel free to skip ahead to the Analysis part.
First, I looked for all events of corners taken.
I then looked at the next 50 events within the next 5 minutes after a corner was taken, to reduce the size of the DataFrame.
I then filtered the Statsbomb event data for relevent events that are listed under the transition states above. Other events like pressures and duels have been filtered out, as they don’t matter when looking for an occuring change of possession or transition.
The biggest challenge here was the question of how to define an occuring transition - when the defending team was able to secure possession or transition into a counter attack - and identifying when the corner sequence would end with possession for the attacking team.
For this I created a few rules that are very much open for debate and can be adjusted.
The reason for using a time window this long was that when a penalty was given, it would usually take a few minutes to be taken.
Secondly, there were a few cases of corners with a huge number of events within a very short timespan. So I needed to make sure I wouldn’t cut a sequence short.
Those are the definitions I used:
absorb to Transition when:
- the Goalkeeper Collects or Smothers the Ball
- the defending team makes a Goal Kick or Throw-In
- the defending team makes a successful pass leaving the defensive third
- the attacking team makes a pass resulting in
['Out', 'Pass Offside'] - the defending team makes an action outside the defensive third*
- the defending team makes a successful Ball Recovery, followed by a successful pass*
- there is a set_piece caused by the offensive team [
Foul Committed] - when there are two consecutive successful passes by the defending team*
- when a half ends (type_name == ‘Half End’)
absorb to Possession (for corner-taking team) when:
- the attacking team makes an action outside the offensive third that is not a Foul Committed
I did not further differentiate between a secured possession for the corner-defending team and a counter attack for now. It is something worthwile for a future extension of this work though.
(*)Here I am unsure of the exact definitions to use - What do you think?
Analysis
Now, that we have layed the foundation of our analysis, we can finally dive into some numbers.
I will make it easy on you and portray the vast majority of all numbers via visualization.
For this part I only consider corners with a first connection within the shown target zones, because I wanted to compare In- vs Outswingers.
I will look at short corners seperately.
This leaves me with a sample of 908 out of 1063 corners, with 53% of corners from the world cup, the rest from the women soccer leagues.
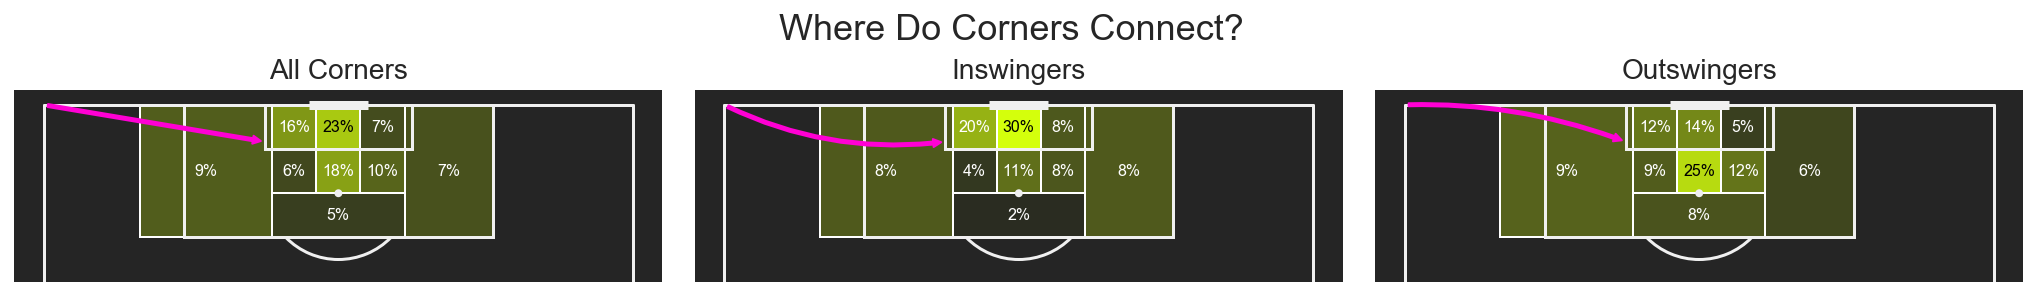
So in general most corners connect right in front of goal, in the near post zone, and in the center zone between the 6y area and the penalty spot.
Also to note here is that inswingers connect far more frequently closer to goal, while outswingers connect much more often outside the 6y area in zones 4-6 and 7.
As we will see below, corners are most often cleared in zones 1 and 2. All of that makes sense intuitively.
![]()
Suprisingly, when looking at the outswingers, in the far zone outside the 6y area (zone 6) as well as inside the 6y area (zone 3) corners are cleared much less frequently. That’s at least interesting.
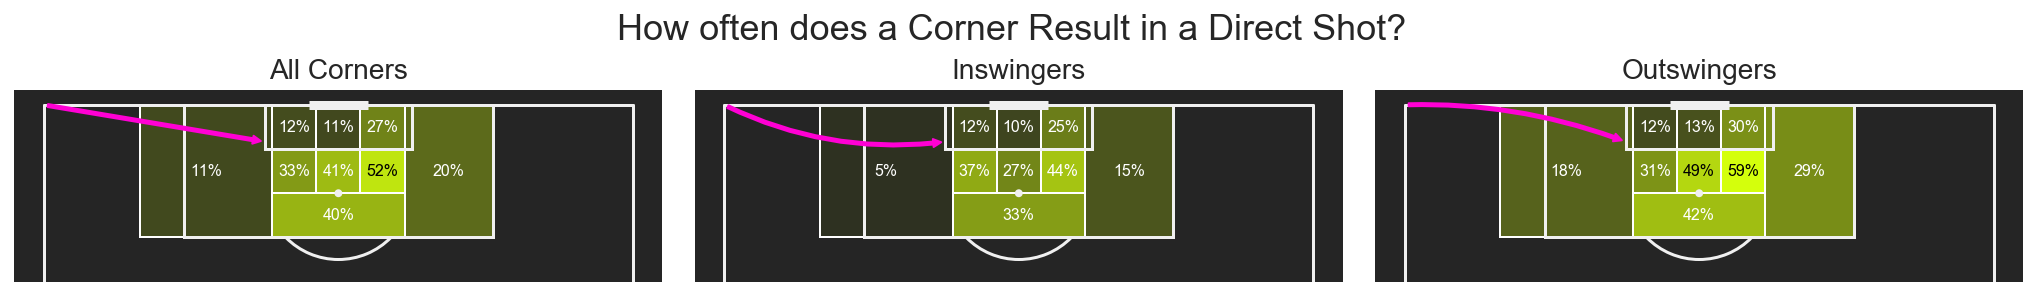
So now we are looking at how often a corner results in a direct shot - one as first action after the corner.
Again, close to goal in zones 1 and 2 it is hard to get a shot off.
Zones further out and the far post zones seem to be much less competed for.
That does not necessarily mean that it must be better to aim for those zones further out.
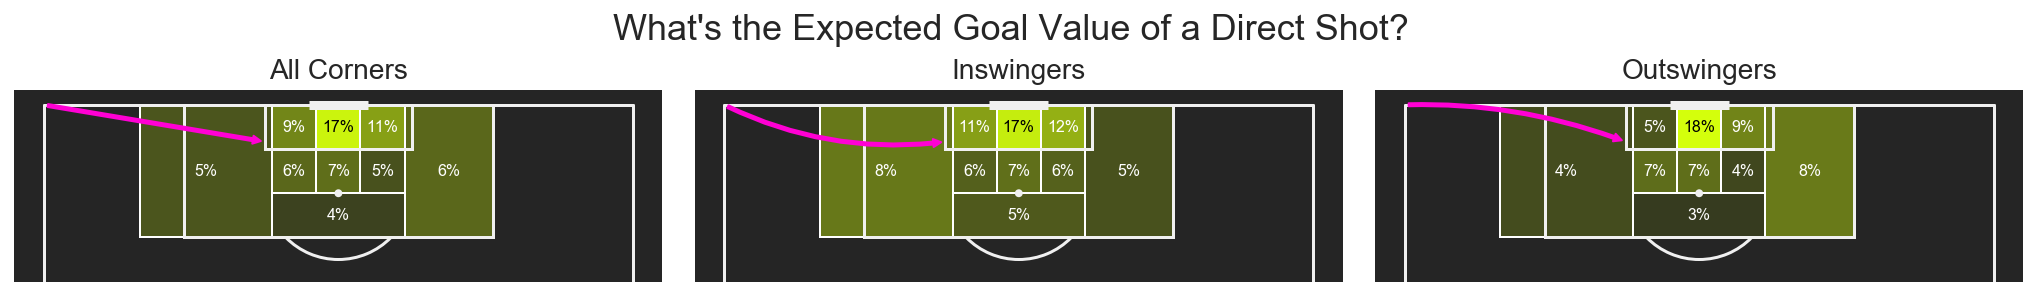
The xG of direct shots is highest right in front of goal. Again, this makes intuitive sense.
What does surprise me though is the high xG value of shots from zone 9 - the one way behind the far post. Again, something to possibly look into further.
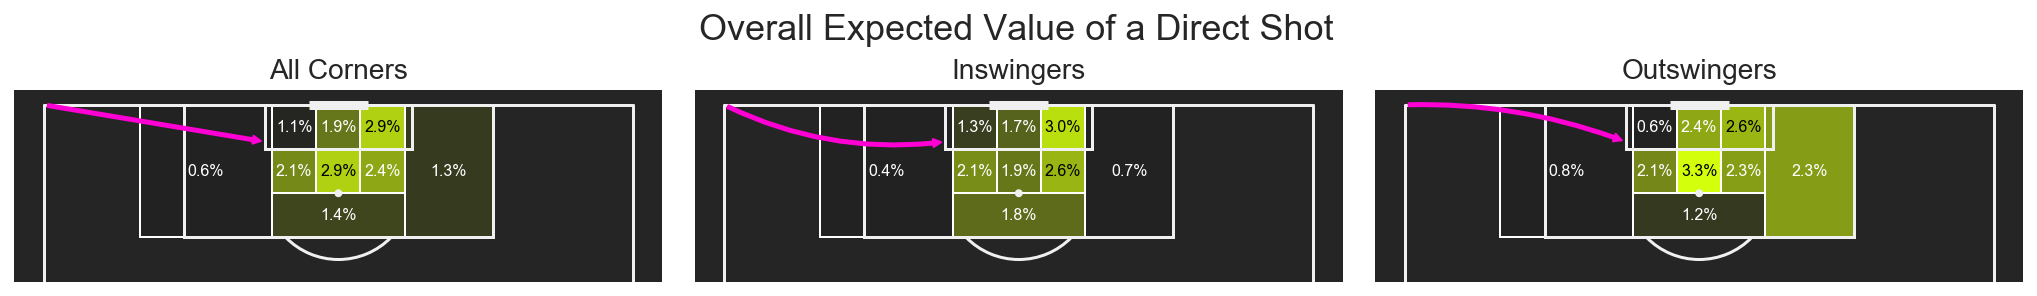
Combining shot probabilities and mean xG Values gives us the overall expected value of a corner that connected in a specific zone.
I should say that this does not mean that you should aim for the zone with highest EV shown here. For example this does not consider that a corner might be hit too low or too far. There is more to consider.
That said, zones 3 and 5 show the highest EVs for all corners at 2.9%, while zone 2 right in front of goal has only a conversion rate of 1.9%. Clearly the rate of connection matters a lot, and here the higher xG values of shots does not make up for the extremely high clearance rate.
The highest value for direct shows is for outswingers in the central zone between 6y box and penalty spot.
This may in part be explained by Englands successful corner routines.
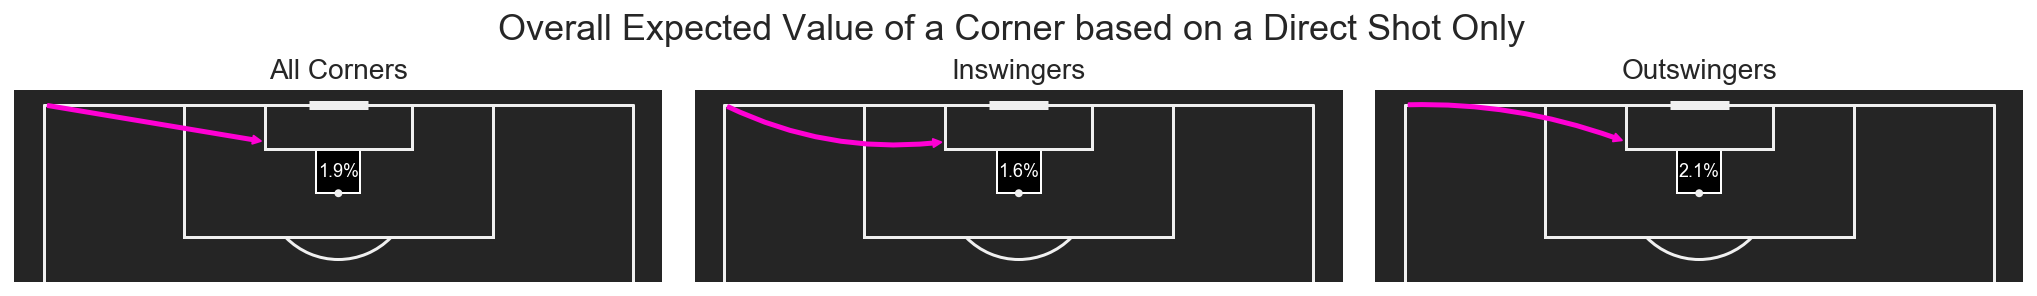
Not differentiating by zones, we get the mean expected values for direct shots from corners.
Overall we have a probability of 1.9% of scoring from a direct shot.
Surprisingly outswingers edge out inswingers by a decent amount through shot volume.
The actual goalrate is 19 out of 908 - 2.1%.
The conversion rate of direct shots is 8.4%.
Let us now consider how the value of a direct shot lines up with prior research:
from The Numbers Game, p.24-26
Chris Anderson and David Sally analyzed data from 134 EPL matches from the 2010/11 season - a total of 1434 corners.
They found that:
- 20.5 percent of corners lead to shots
- 1 of every 9 shot leads to a goal
- The average corner is worth about 0.022 goals
Paul Power found a 2.1% chance of scoring a goal from a corner.
Craig Pulling found that 2.7% of corners lead to a goal from the first contact.
Casal et al. collected multiple studies where they cited results of goal probabilities between 1.25% and 10.22% with a median of about 3% and a Standard Deviation of about 0.03 Goals (when I remove the most extreme outlier of 33%).
In their own study they found a success rate of 2.2%
We are Premier League: The Value of Corners found that between 1 and 7% of Corner Sequences lead to Goals.
One of the few sources I found that did consider corner sequences and not only consider direct shots. The mean total value seems to be >around 4% here.
The results match up well overall with prior findings.
As I explained earlier, considering direct shots only is just part of the story though.
The next time I will look into indirect shots, shots from regains and rebounds and look at how corner sequences end.
I will then combine this to get a better view on how much a corner is really worth.
I would welcome any feedback or questions on Twitter
@danzn1
Further Resources on Corners
Most Corners Fail to Beat the First Man
The Data used in this article is Statsbomb’s free Dataset